FTIR Fingerprinting: a case study on mineral inclusion identification by FTIR applied on rubies from marble-hosted deposits

By Walter A. Balmer

Keywords: FTIR fingerprinting, identification of mineral inclusions, higher-order phonon lines

Introduction

Fourier-Transform Infrared Spectrometry (FTIR) is a well-established analytical method in the field of gemmology (Suhner, 1979; Fritsch and Stockton, 1987; Smith, 1995; Beran and Rossman, 2006) and therefore used in many laboratories around the world. In this study which was part of a Ph.D. project (Balmer, 2011), FTIR fingerprinting was introduced as a comparative procedure in order to identify mineral inclusions by FTIR. The potential of such an approach was examined as a case study on rubies from marble-hosted deposits.

FTIR fingerprinting can be described as a procedure to compare FTIR signatures of known reference minerals with a sample spectrum in order to identify mineral phases which are present as inclusions in the host mineral. In corundum testing this approach is currently carried out on a routinely bases on a few aluminium- and iron-hydroxide phases such as diaspore, boehmite and goethite along with the minerals chlorite and kaolinite only.

One reason why FTIR fingerprinting has not yet been applied for a wider range of minerals may be the limited availability of reference spectra in the appropriate spectrum range. In order to avoid the strong absorption of the host-mineral itself and to allow identification of superimposed vibronic signals of mineral inclusions this range is between 1500 cm-1 and 5000 cm-1 (in the case of corundum). Typically, spectra from the RUFF reference database are limited to 4000cm-1 and are often obtained by Attenuated Total Reflectance (ATR) showing a low signal to noise ratio (SNR) in the mentioned spectrum range.

Further, the strong absorption of the corundum limits observations to higher-order vibrations or phonon lines of potential mineral inclusions. This implies that the zero-phonon lines which typically would be considered diagnostic, are not available. Further, the higher-order equivalents are per se lower in intensity, not as well-known nor well-referenced and therefore not been used systematically for mineral phase identification purposes in gemmology so far. Superimposed on the host-mineral’s spectrum and in some cases even interfering with phonon lines of other mineral inclusions as well as atmospheric artefacts (e.g. water vapour) a vibronic overtone signal of a given mineral inclusion can easily be missed or misinterpreted.

Reference Material and Measurement Conditions

In the framework of this study, macroscopic reference mineral samples including the amphibole varieties actinolite and pargasite, the carbonate mineral dolomite, the aluminium-hydroxide diaspore, as well as tourmaline of a dravite-uvite composition were examined. The KBr reference samples on the other hand included the mineral phases calcite, the phyllosilicates chlorite, phlogopite, and muscovite, the iron-hydroxide goethite as well as the aluminium-hydroxide gibbsite.

Except from a simple cleaning procedure using a lint free cloth which was first moisturised by ethanol, the cut and polished macroscopic reference samples needed no further preparation. The sample materials for KBr pellets however had to be crushed and powdered using an agate mortar and pistil first. Then the powdered sample was mixed with KBr powder in the weight ratio of 1:100 to receive a sample with a total weight of 1g. Finally, the KBr pellet was pressed in a simple screw-press device.

The FTIR spectra in this study were collected by a Thermo Nicolet 6700 spectrometer at the premises of the Gem and Jewelry Institute of Thailand (GIT) in Bangkok. A beam condenser unit for data collection on cut and polished samples or a simple transmission sample holder for KBr pellets was applied respectively. The spectra were collected in absorbance between 1500 and 5000cm-1 with increments of 1cm-1.

To improve the SNR as well as decreasing atmospheric noise, 124 measurements were accumulated for each sample. The obtained reference spectra were then compared with ruby spectra (n=87) from six different marble-hosted deposits.

Results and Discussion

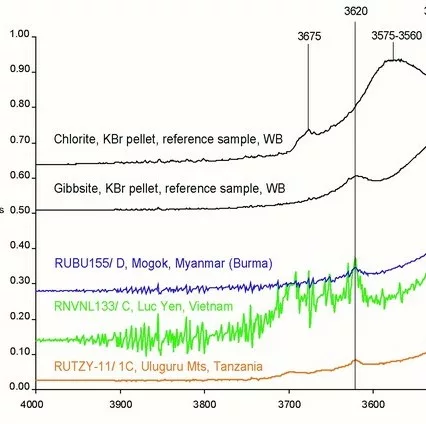
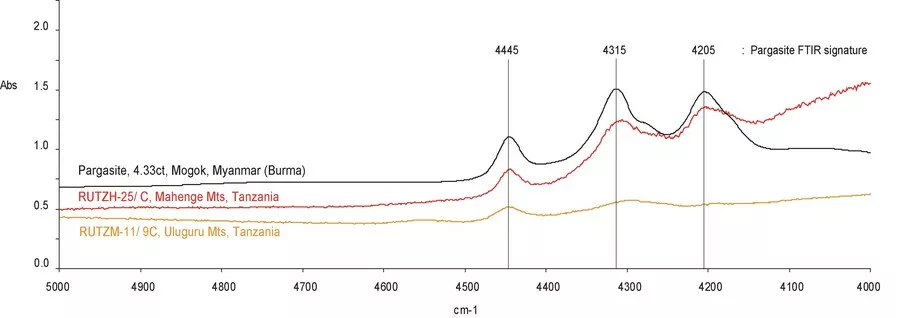
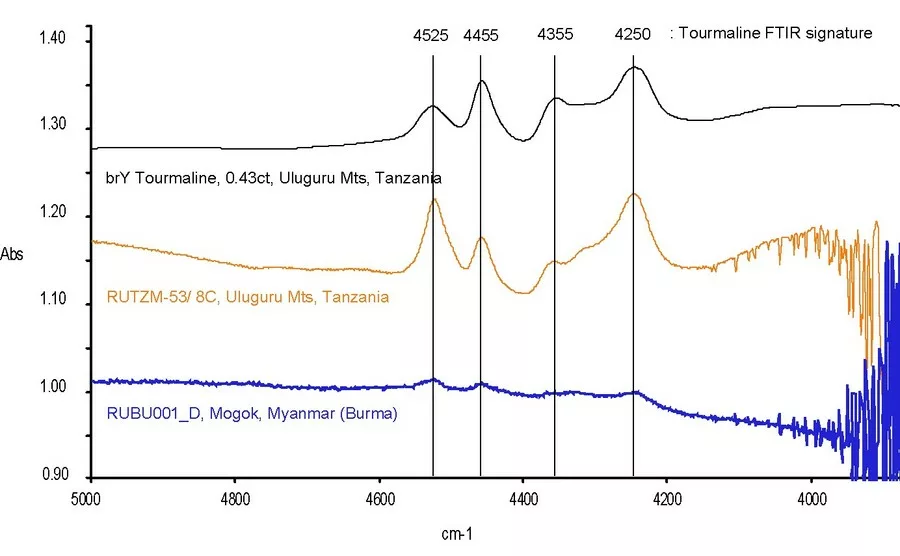
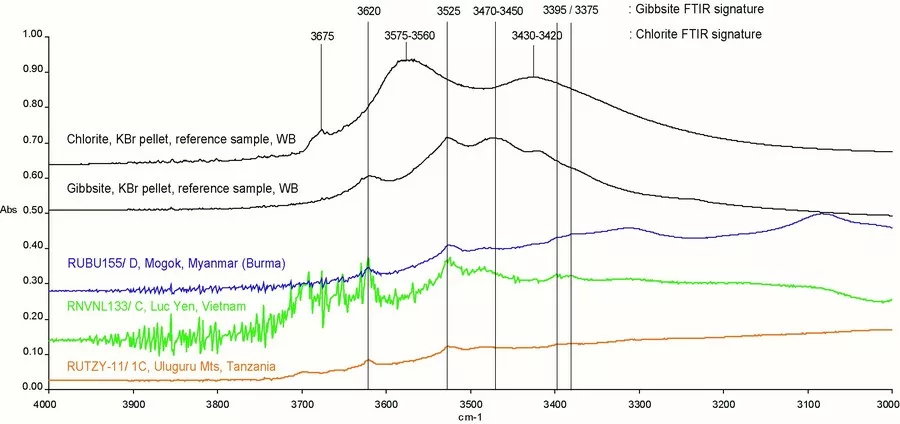
During this study, it was possible to detect pargasite amphibole, tourmaline, and gibbsite as inclusions by FTIR fingerprinting in corundum (see Figure 1 & 2).

Figure 1: The comparison of a FTIR spectrum of a transparent 4.33ct pargasite amphibole reference sample from Mogok, Myanmar (Burma) with the weak but still detectable superimposed signature in a ruby from the Uluguru Mts, Tanzania (RUTZM-11/ 9C) and the Mahenge Mts, Tanzania (RUTZH-25/ C) allowed the identification of pargasite amphibole to be present as a mineral inclusion in the examined ruby samples.
Figure 2: The FTIR reference spectrum of a 0.43 ct, cut, brownish-yellow, dravite-uvite tourmaline sample from the Uluguru Mts, Tanzania was compared with ruby spectra recorded in this study. The comparison revealed the presence of tourmaline as an inclusion in the two ruby samples shown above.

The peaks in the range from 3200-3800cm-1 have traditionally been attributed to kaolinite and chlorite group minerals in gemmology (Beran and Rossman, 2006). During the FTIR investigation in this study, however, it was recognised that these peaks might have been misinterpreted occasionally in the past. The reason for calling a long-standing interpretation into question is another phase which shows peaks in the same spectral range. In the examined water stretching vibration range gibbsite [Al(OH3 )], an aluminium-hydroxide, shows specific peaks at 3375/3395, 3455, 3525, and 3620cm-1 (Kloprogge et al., 2002; Balan et al., 2006). On the other hand, a chlorite KBr pellet sample investigated in this study (see Figure 3) as well as the spectra of chlorite group minerals published in the RRUFF spectra database lack the peaks at 3525cm-1 and 3620cm-1 . Additionally, the detection of gibbsite as a mineral inclusion implies that the examined corundum sample did not experience heat above 350°C (Kloprogge et al., 2002).

Figure 3: The comparison of two KBr pellet FTIR spectra obtained from a chlorite and gibbsite reference sample respectively, reveals clear differences in the main features of the FTIR signatures of these two minerals. Although the superimposed signal is not intensive in the spectra of the three examined ruby samples, it is still possible to clearly determine the presence of gibbsite in all three spectra. The peaks not labelled in the spectra are caused by inclusions of kaolinite in sample RUTZY-11/ 1C, boehmite and calcite in RUBU155/ C respectively.

Conclusion

In this study, it was possible to show that careful FTIR spectrum investigations especially beyond the water stretching vibration range (>3300cm-1 ) may reveal superimposed but diagnostically significant higher-order vibronic signals of various mineral inclusions. Compared with reference spectra in the appropriate spectrum range, the identification of such inclusions is made possible by FTIR fingerprinting. Therefore, high resolution reference spectra in the specific spectrum range including the most significant minerals known to occur as inclusions are key to an accurate spectrum interpretation by FTIR fingerprinting. Only if these pre-conditions are fulfilled and combined with the skills of an experienced FTIR operator the full information available in an FTIR spectrum can be extracted.

As an additional result of this study, the vibronic signatures of chlorite and gibbsite were characterised in the mentioned spectrum range, thus making the positive identification and separation between these two mineral phases possible by FTIR fingerprinting.

The identification of mineral inclusions by FTIR fingerprinting can be used as a valuable tool in excluding heat-treatment as a possibility, by indicating the presence of heat-sensitive mineral inclusions such as gibbsite, and in geographic origin determination. FTIR fingerprinting is also a viable alternative especially when access to more advanced analytic methods such as Raman spectrometry or LA-ICP-MS is limited. And as a non-destructive method FTIR fingerprinting can easily be included as an additional criterion in gem testing procedures in general and corundum testing in particular.

Finally, the results by FTIR fingerprinting published in this study are promising and encourage to further investigate FTIR spectra features beyond the range which is traditionally considered in gemmology. Even more so, because this study focused on rubies from marble-hosted deposits only. It is assumed that corundum from different deposit types as well as other host-minerals may reveal similar and additional features, which had not been discovered in this study yet.

References:

  • Balan, E., et al., 2006. First-principle study of the OHstretching modes of gibbsite, American Mineralogist, 91, 115-119.
  • Balmer, W.A., 2011. Petrology, Geochemistry, and Gemmological Characteristics of Marble-Hosted Ruby Deposits of Morogoro and Mahenge, Tanzania, unpublished Ph.D. thesis, Chulalongkorn University, Bangkok Thailand, 185pp.
  • Beran, A., Rossman, G.R., 2006. OH in naturally occurring corundum, European Journal of Mineralogy, 18(4), 441-447.
  • Fritsch, E., Stockton, C.M., 1987. Infrared spectrometry in gem identification, Gems & Gemology, 23(1), 18-26.
  • Kloprogge, J.T., Ruan, H., Ray L., Frost, 2002. Thermal decomposition of bauxite minerals: infrared emission spectroscopy of gibbsite, boehmite, and diaspore, Journal of Material Science, 37, 1121-1129.
  • Smith, C.P., 1995. A contribution to understanding the infrared spectra of rubies from Mong Hsu, Myanmar, Journal of Gemmology, 24(5), 321-335.
  • Suhner, B., 1979. Infrarot-Spektren in der Gemmologie. Zeitschrift der Deutschen Gemmologischen Gesellschaft, 28(2), 55-68.