Applications of Python for Spectroscopic Data Processing, Analysis and Machine Learning Modeling in Gemmology

By Tasnara Sripoonjan, Bhuwadol Wanthanachaisaeng

Keywords: Python, Machine Learning, ML, algorithms, gemmological analysis

Introduction

Python, a powerful programming tool with extensive scientific computing capabilities, is being increasingly utilized in gemmological science. It is particularly well-suited for processing and analyzing spectroscopic data, which is crucial for various machine learning (ML) applications in gemmology. By leveraging ML algorithms and models, Python can automate time-consuming tasks, reduce human error, and enhance the overall efficiency of gemmological analysis and identification. This article will provide a general overview of how Python processes and analyzes spectroscopic data, highlighting its significance in ML-based gemmological data modeling.

Why Python?

Python is a popular high-level, interpreted programming language known for its strong code abstraction, making it easily understandable for humans. It has gained wide acceptance in various domains, including data science, artificial intelligence, and scientific computing. Python’s modularity is a significant advantage, allowing users to import and utilize pre-existing code through packages and libraries designed for specific tasks. Its extensive library ecosystem makes Python suitable for diverse scientific applications, such as analyzing large datasets, creating informative visualizations, and developing advanced models. In scientific disciplines like earth science, geology, and gemmology, Python’s versatility shines. Noteworthy libraries that enhance Python’s scientific capabilities include:

  1.  NumPy: Supports large arrays and mathematical functions for efficient spectroscopic data manipulation.
  2. SciPy: Provides modules for optimization, signal processing, linear algebra, and spectral deconvolution.
  3. Pandas: Simplifies analysis of large datasets with data structures like DataFrames and Series.
  4. Matplotlib: A plotting library for creating static, animated, and interactive visualizations, such as line and scatter.
  5. Scikit-learn: Tools for predictive modeling, ML algorithms for gemmological determination and classification.

Machine Learning for Gemmological Applications

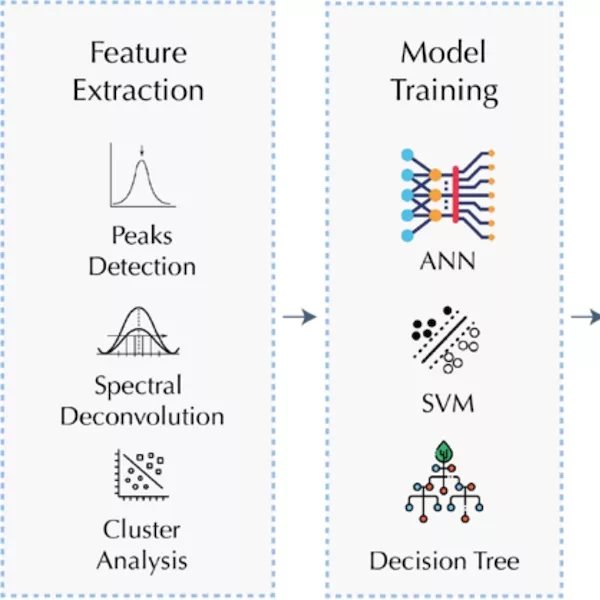
ML provides an alternative to conventional identification methods that mostly rely on expert knowledge and experience alone. ML algorithms can learn and recognize distinctive properties and characteristic features of gemstones (Wang & Krzemnicki, 2021; Wanthanachaisaeng et al., 2022), such as trace element concentrations and spectral data. For example, to determine the country of origin of emeralds, trace element analysis can be employed, focusing on clustering patterns among elements such as K, V, Cr, Fe, Rb, and Cs. Additionally, the analysis of emerald treatment primarily relies on identifying characteristic peaks within the 2700-3200 cm-1 range of FTIR spectra. Support Vector Machines (SVM), Decision Trees & Random Forests, K-Nearest Neighbors (KNN), and Neural Networks & Deep Learning are examples of supervised learning algorithms, where models are trained using labeled data with known outputs to make predictions on new, unseen data. On the other hand, Principal Component Analysis (PCA) is an example of unsupervised learning, where models are trained on unlabeled data to discover hidden patterns, structures, or relationships.

Examples of Gemstone Analysis Process using Python and Machine Learning

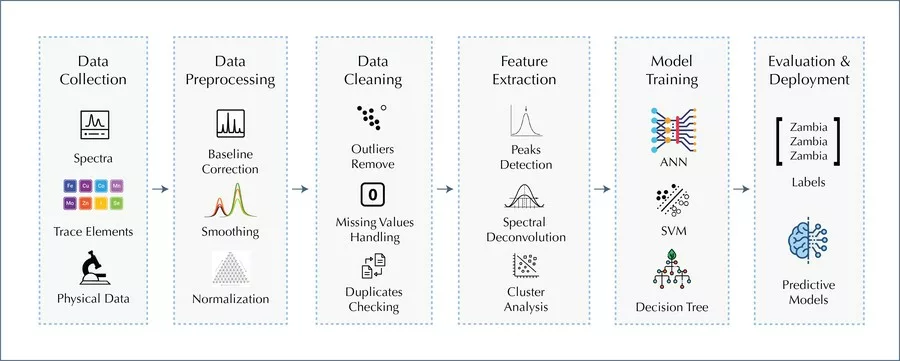
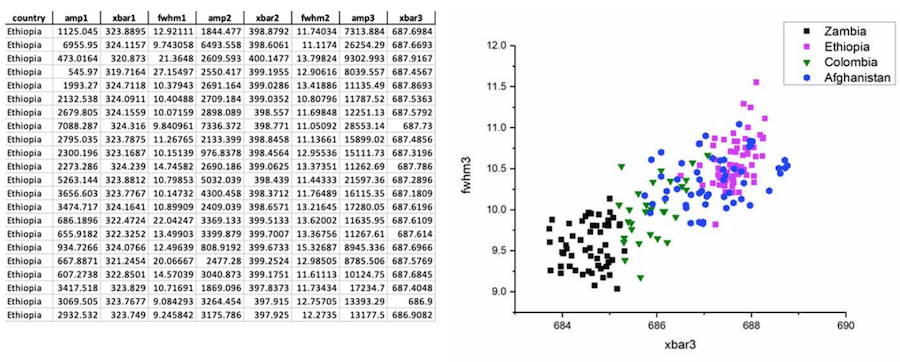
This section provides guidance on the typical steps in analyzing and modeling gemmological spectroscopic data using Python. The process involves data collection, preprocessing, cleaning, and feature extraction, followed by Let’s begin by examining the first step of the process: (1) Data collection: Digital raw data from techniques like Raman, FTIR, EDXRF, and trace elements are collected and stored in various file formats such as CSV, ASCII, or TXT. Python libraries like Pandas, NumPy, and SciPy, can read, manipulate, and combine these files into the desired format, preparing them for pre-processing and analysis. model training, evaluation, and deployment. It is important to note that analyzing and modeling gemmological spectroscopic data can vary depending on the dataset, research question, and intended application. Thus, the examples in this section are a general guide rather than a rigid set of rules. Figure 1 provides an overview of the entire process.

Figure 1. Python and Machine Learning (ML) workflow for gemmological applications.

Let’s begin by examining the first step of the process:

(1) Data collection: Digital raw data from techniques like Raman, FTIR, EDXRF, and trace elements are collected and stored in various file formats such as CSV, ASCII, or TXT. Python libraries like Pandas, NumPy, and SciPy, can read, manipulate, and combine these files into the desired format, preparing them for pre-processing and analysis. model training, evaluation, and deployment. It is important to note that analyzing and modeling gemmological spectroscopic data can vary depending on the dataset, research question, and intended application. Thus, the examples in this section are a general guide rather than a rigid set of rules. Figure 1 provides an overview of the entire process.

(2) Pre-processing: In spectroscopy, specifically Raman spectrum, pre-processing steps like baseline correction, smoothing, and normalization are commonly used to eliminate background fluorescence, instrument noise, and other interferences. The asymmetry least squares (ALS) method is a popular algorithm for baseline correction, implementable in Python using the “als” function from the SciPy library (Figure 2). Applying a Savitzky-Golay filter through the ‘savgol_filter’ function can effectively denoise and improve the signal-to-noise ratio of a one-dimensional signal. While not demonstrated here, spectrum normalization using SciPy is essential for establishing a consistent metric.

Figure 2. Show here is ALS-based baseline estimation algorithm in SciPy library was used to process a spectrum. The red line represents the baseline estimation of a typical emerald spectrum (left) and result after subtraction (right).
Figure 3. Python offers automation capabilities for extracting spectral features. These include peak detection, which marks the identified peaks as input data for further processing (left). The representative spectrum demonstrates the prominent Raman peaks of emeralds (i.e., 323, 387, 686, 1005, and 1070 cm-1), which are selected for FWHM estimation (right).

(3) Data cleaning: Outliers and artifacts can be problematic in datasets, especially for clustering tasks like gem origin determination based on trace-element concentration patterns. Data cleaning techniques, such as z-score and quantile approaches, help identify and eliminate undesirable outliers and artifacts. By removing data points that deviate significantly from the mean or fall outside the expected range, these methods ensure accurate and reliable results, enhancing the overall data quality.

(4) Feature extraction: In gemmological applications, with spectral data playing a vital role. Manually working with extensive datasets can be time-consuming, particularly when dealing with relevant features hidden within spectra. The SciPy provides peak detection and curve fitting capabilities (Figure 3), allowing for the peaks fitting and full width at half maximum (FWHM) estimation using mathematical formulas such as Gaussian and Lorentzian functions (Ewusi-Annan and Melikechi, 2021). These methods enable the extraction of FWHM values for multiple peaks in a batch or simultaneous manner, thereby facilitating efficient characterization of spectral features. Python automates selection of all or specific peaks in spectra. FWHM values extracted from multiple peaks support further interpretation and in-depth analysis. Figure 4 demonstrates their application in aiding emerald’s origin determination.

Figure 4. An example of spreadsheet illustrating FWHM values obtained from the selected Raman peaks of emeralds using Python coding techniques. The extracted data can be further utilized for interpretation, clustering visualization, and aiding in the determination of the emerald's origins in the certain case (right).

The processed data, relied on FWHM values of the selected Raman band (~686 cm-1) in emeralds from different deposits (Zambia, Ethiopia, Colombia, Afghanistan), revealed a spectral feature associated with the difference in peak bandwidth. This feature correlates with the unique crystal structure and also corresponds to varying refractive index of emeralds found from each deposit (Zwaan et al., 2005), making it a potential candidate for ML modeling.

(5) Modeling and evaluation: The processed data is imported for modeling using learning algorithms with the aid of statistical techniques via Python. The choice between supervised or unsupervised learning depends on the data characteristics, and in this study, supervised learning is only employed for demonstration. Model performance is evaluated using metrics such as confusion matrices, accuracy, precision, recall and f1-score. These metrics provide insights into the effectiveness of the model and assist in selecting the appropriate algorithm. The widely recognized Scikit-learn library offers tools for calculating and interpreting these metrics.

In general, precision measures accurate positive predictions, recall measures finding all positive instances, and the F1 score balances precision and recall. Accuracy evaluates correct class labels. Figure 5 (left) shows the EPA model with ANN using the FWHM feature with 53% accuracy, considered inconsistent. Nevertheless, it may have utility for certain circumstance like distinguishing Zambian from Ethiopian emeralds. In contrast, our research utilized trace-element concentration achieving 94% accuracy (Figure 5, right). However, overfitting can occur when a model performs well on training data but fails to generalize unknown data. Proper feature management and understanding limitations are crucial for ML application. Continuous improvement through model updating and fine-tuning is essential.

Challenges and Future Prospects

As is well-known, certain popular software packages are effective tools for processing, analyzing, and visualizing spectroscopic data. However, these packages may not be able to automate tasks or develop ML models. In contrast, Python provides sophisticated and customizable solutions for complex ML tasks and algorithms. Proficiency in programming is necessary to leverage these capabilities, and the visualization features may be limited compared to the dedicated spectroscopy software.

Access to high-quality datasets for training ML models in gemmology may be limited, which can hinder their effectiveness and make it challenging to create accurate models and understand the features behind their predictions. These issues are likely to impact gemmologists’ trust if wrong results are significantly produced by ML models.

Figure 5. Data characteristics play a crucial role in accurate predictions during modeling, as shown in the emerald origin determination based on peak FWHM values (left) and trace element concentrations (right) using the same algorithm.

Conclusion

In conclusion, Python can greatly benefit automated tasks and data analysis, but we assume that Machine Learning (ML) algorithms will become more important in gemstone analysis in the future. Python’s versatility and scientific computing capabilities are considered suitable for processing and analyzing spectroscopy data, while ML algorithms may enhance the accuracy of gemstone determination. The effectiveness of ML can be hindered by various challenges, including the limited availability of high-quality data, model complexity, and difficulty in understanding algorithms. Nevertheless, we are convinced that improved gemological analysis with data science may overcome these challenges and eventually lead to more accurate and reliable ML models in the future.

References:

  • Barton, S. J., Ward, T. E. Hennelly, B. M. 2018. Algorithm for optimal denoising of Raman spectra. Analytical Methods, 10, pp. 3759-3769
  • Eilers, P. H. C., and Boelens, H. F. M. 2005. Baseline correction with asymmetric least squares smoothing. Leiden University Medical Centre Report, 1-22.
  • Ewusi-Annan, E., & Melikechi, N. 2021. Unsupervised fitting of emission lines generated from laser-induced breakdown spectroscopy. Spectrochimica Acta Part B: Atomic Spectroscopy, 177(50–55): 106109
  • GIT. 2021. New Directions: An Announcement from GIT on their work using AI as a New Tool for the Origin Determination of Gemstones. The Journal of The Gemmological Association of Hong Kong. 42, pp 5.
  • He, S., et al. 2014. Baseline correction for Raman spectra using an improved asymmetric least squares method. Analytical Methods, 6(12): 4402-4407.
  • Li, Y., Feng, X., Liu, Y., Han, X. 2021. Apple quality identification and classification by image processing based on convolutional neural networks. Sci Rep 11, 16618.
  • Petrelli, M. 2021. Introduction to Pythonin Earth Science Data Analysis: From Descriptive Statistics to Machine Learning. Springer Textbooks in Earth Sciences, Geography and Environment. Springer Cham, 229p.
  • Wanthanachaisaeng, B., et al. 2022. An Artificial Intelligence Approach to Build Smart Databases for Origin Determination of Ruby and Sapphire. Bangkok Gems and Jewelry Fair, Bangkok, (Online).
  • Zwaan, H., et al. 2005. Emeralds from the Kafubu Area, Zambia. Gems & Gemology 41(2): 116-148.